User Guide
This walks through the control room as a signed-out viewer, then as a signed-in operator driving an incident end to end. Screenshots are from the deterministic mock crew, which behaves identically to the real Gemini + Grafana crew from the UI's point of view.
The control room, signed out
Opening the app lands you on the control room — the live agent-status bar, the QoE map by region, the agent activity feed, and the incident list. This is a read-only view on purpose: no sign-in is required to watch what the crew is doing.
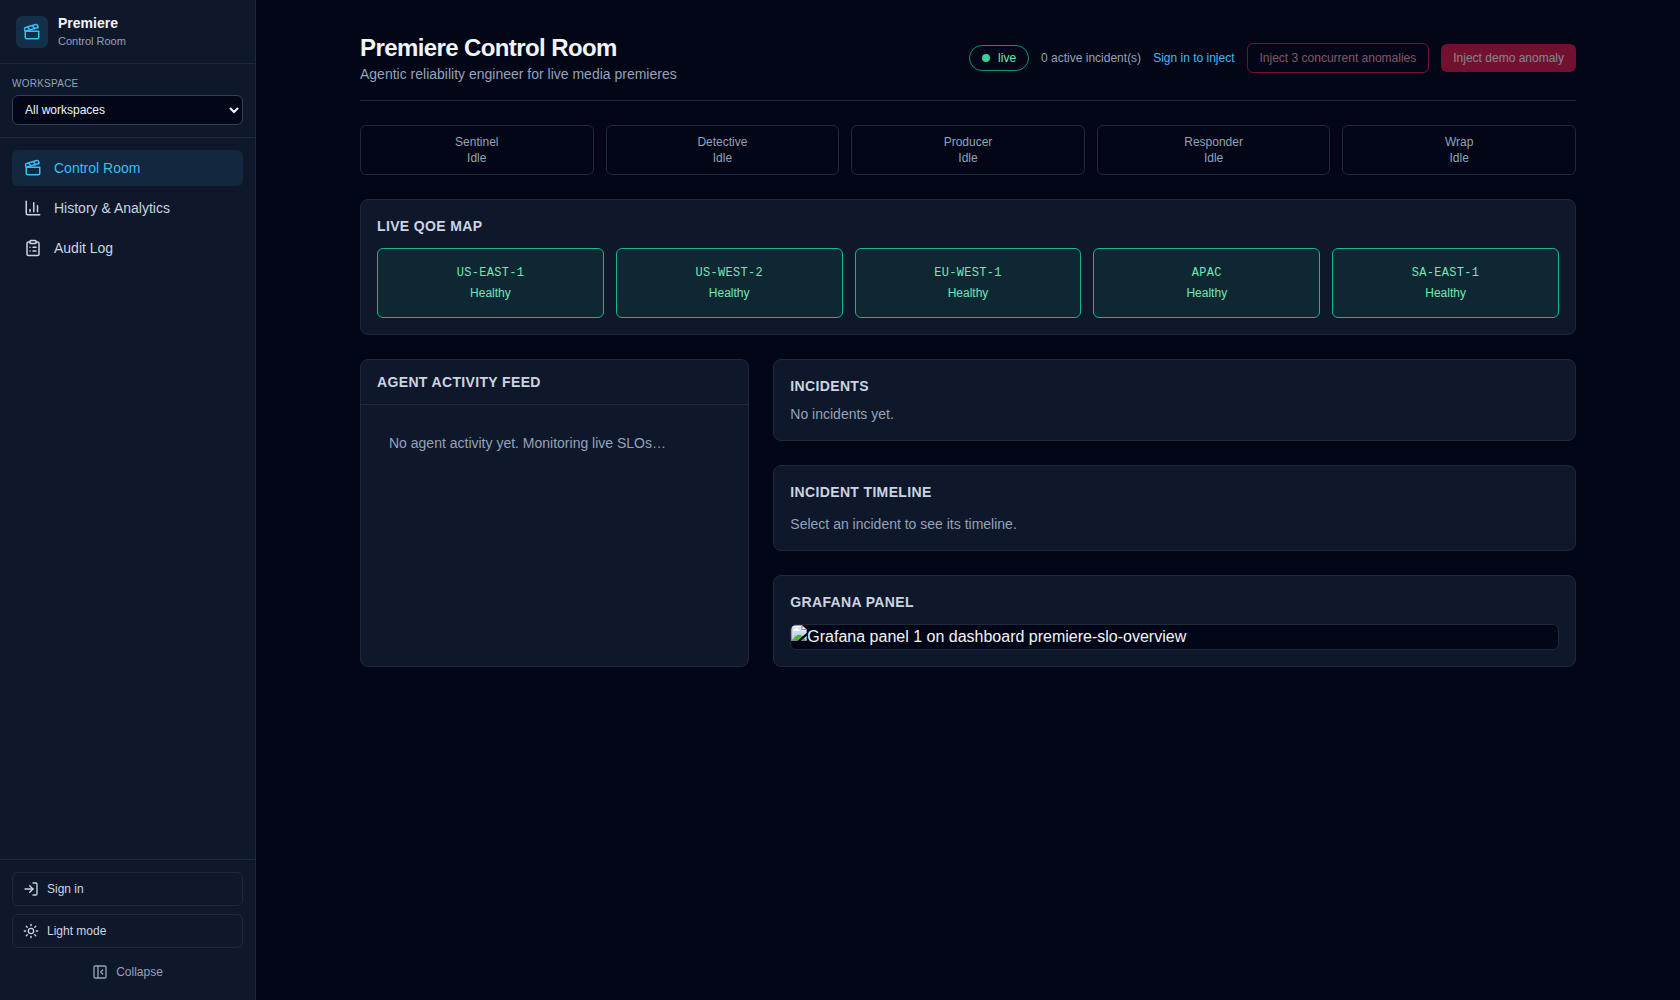
Notice the Inject buttons are disabled and there's a "Sign in to inject" link — taking any action (injecting a demo incident, approving/rejecting a remediation) requires an account. Watching does not.
Signing in
Click Sign in in the sidebar (or the "Sign in to inject" link) to reach the login page.
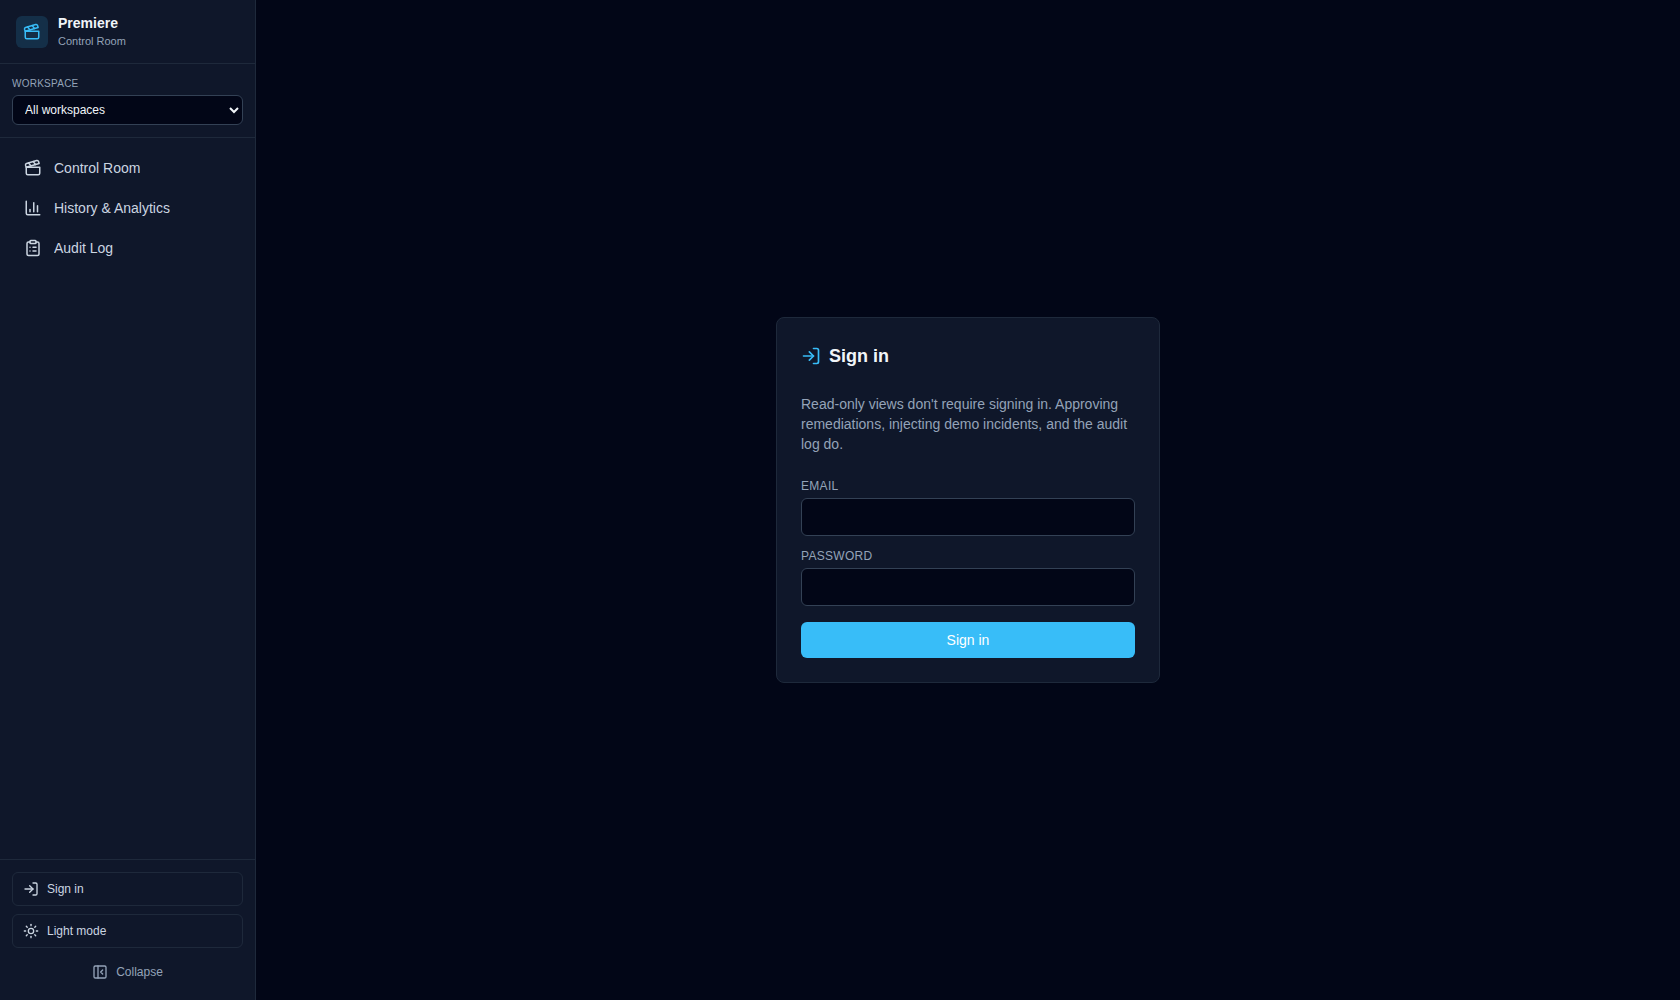
If you don't have an account yet, ask an admin to create one for you, or — for your own local/first deployment — use the bootstrap admin account created on first startup (see Setup Guide → Signing in for where to find its password).
Roles
Three tiers, each a superset of the one before it:
| Role | Can do |
|---|---|
| viewer | Everything unauthenticated users can already do (the control room and history are public) — this tier exists for future read-gated routes |
| operator | Approve/reject remediations, inject demo anomalies, trigger chaos |
| admin | Everything operator can, plus creating/revoking users and creating workspaces |
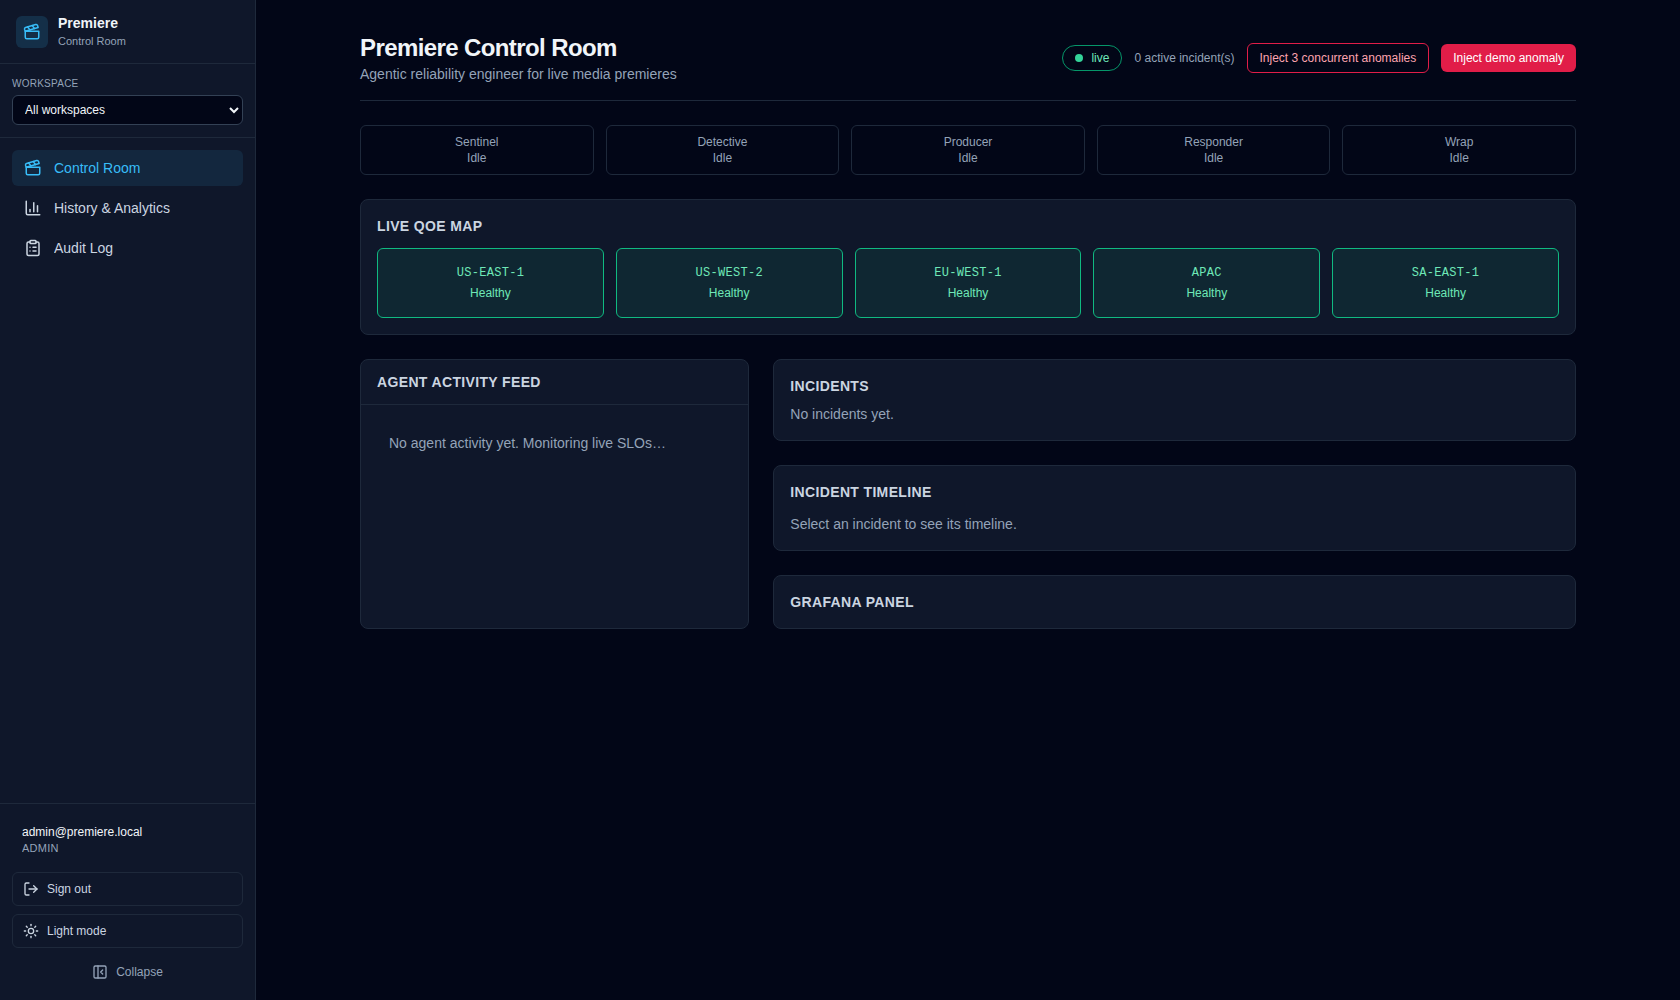
Once signed in, the sidebar shows your email and role, with a Sign out button below it.
Driving an incident
With an operator (or admin) account, the two red buttons in the header become active:
- Inject demo anomaly — starts one incident with a random metric/region combination.
- Inject 3 concurrent anomalies — starts three at once, useful for seeing the crew and UI handle overlapping incidents (each agent tracks state per-incident, not globally).
Clicking either drives the full crew loop: Sentinel flags the breach, Detective investigates (checking whether this metric has broken before and citing that precedent if so), Producer writes an incident brief, and Responder either executes a low-risk fix immediately or — for a high-risk action — blocks and asks for your approval.
Approving or rejecting
A high-risk remediation surfaces a modal with the proposed action and its description. Approve or Reject — either way the incident continues to a postmortem; a rejected action is recorded as skipped rather than executed. If you're not signed in as an operator, the buttons are disabled with a prompt to sign in.
If nobody responds within a few minutes, the crew sends a second notification (webhook/Slack, if configured) rather than waiting on you indefinitely — see Agent Layer → Escalation and notifications.
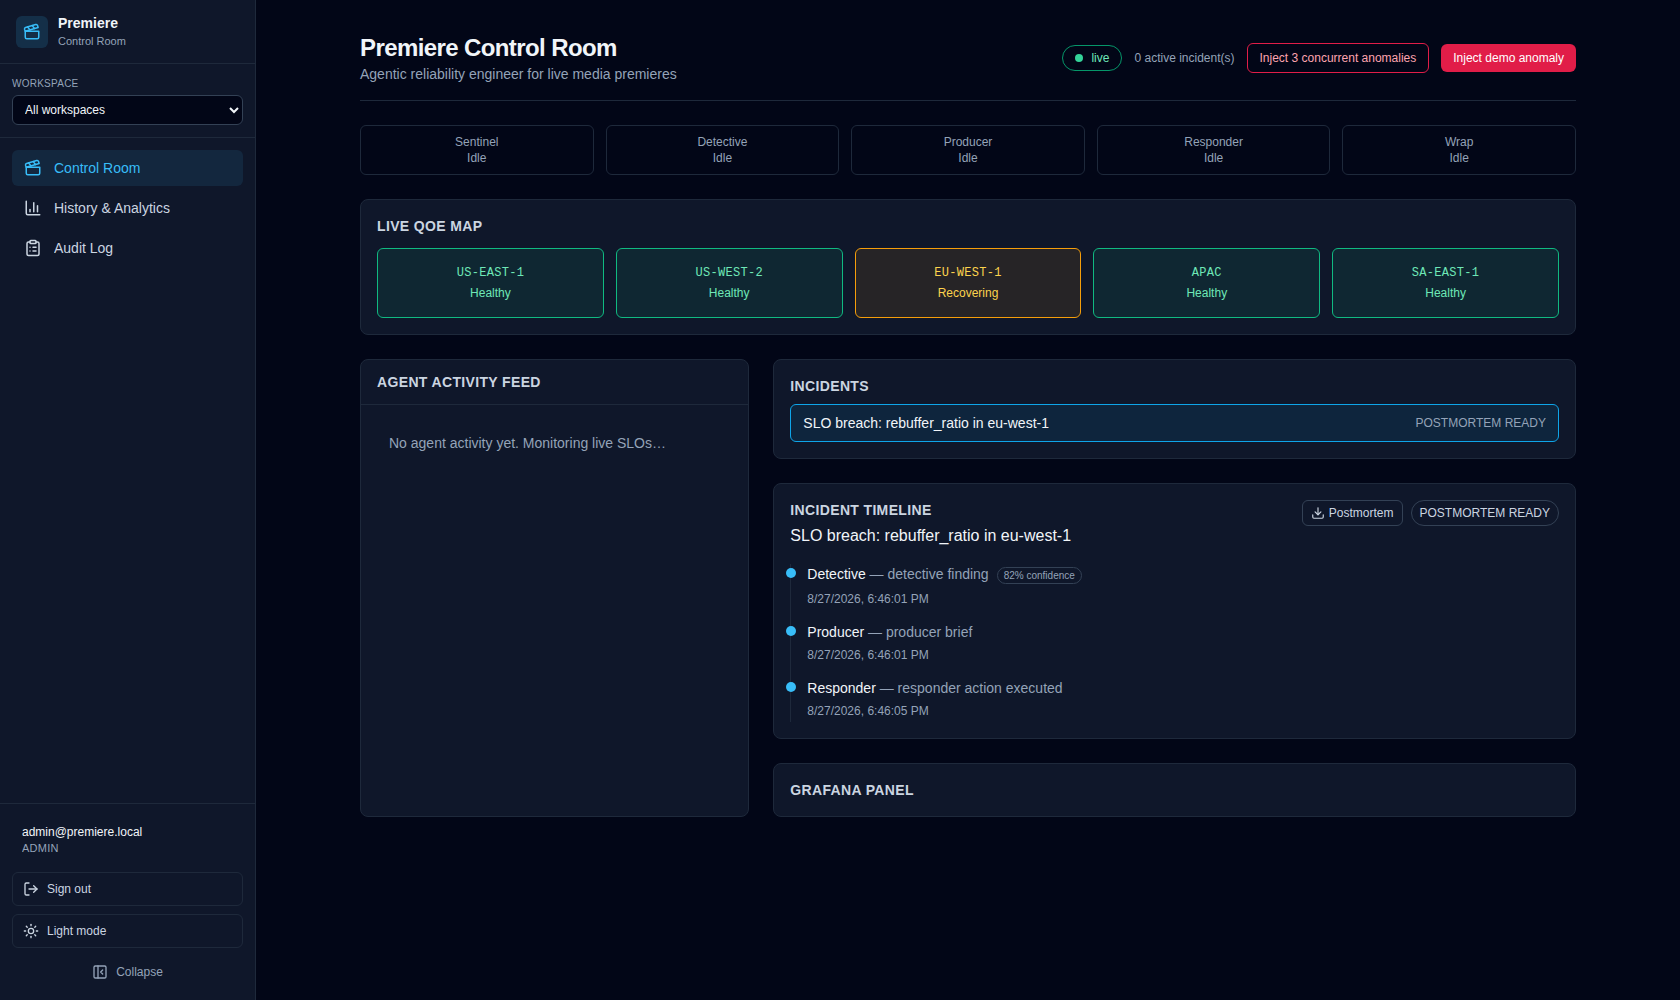
Reading the incident timeline
Select any incident from the list to see its full timeline: which agent did what and when, the Detective's confidence in its root-cause hypothesis, and — once the postmortem is ready — a one-click markdown download and a running total of Gemini token usage for that incident.
History & Analytics
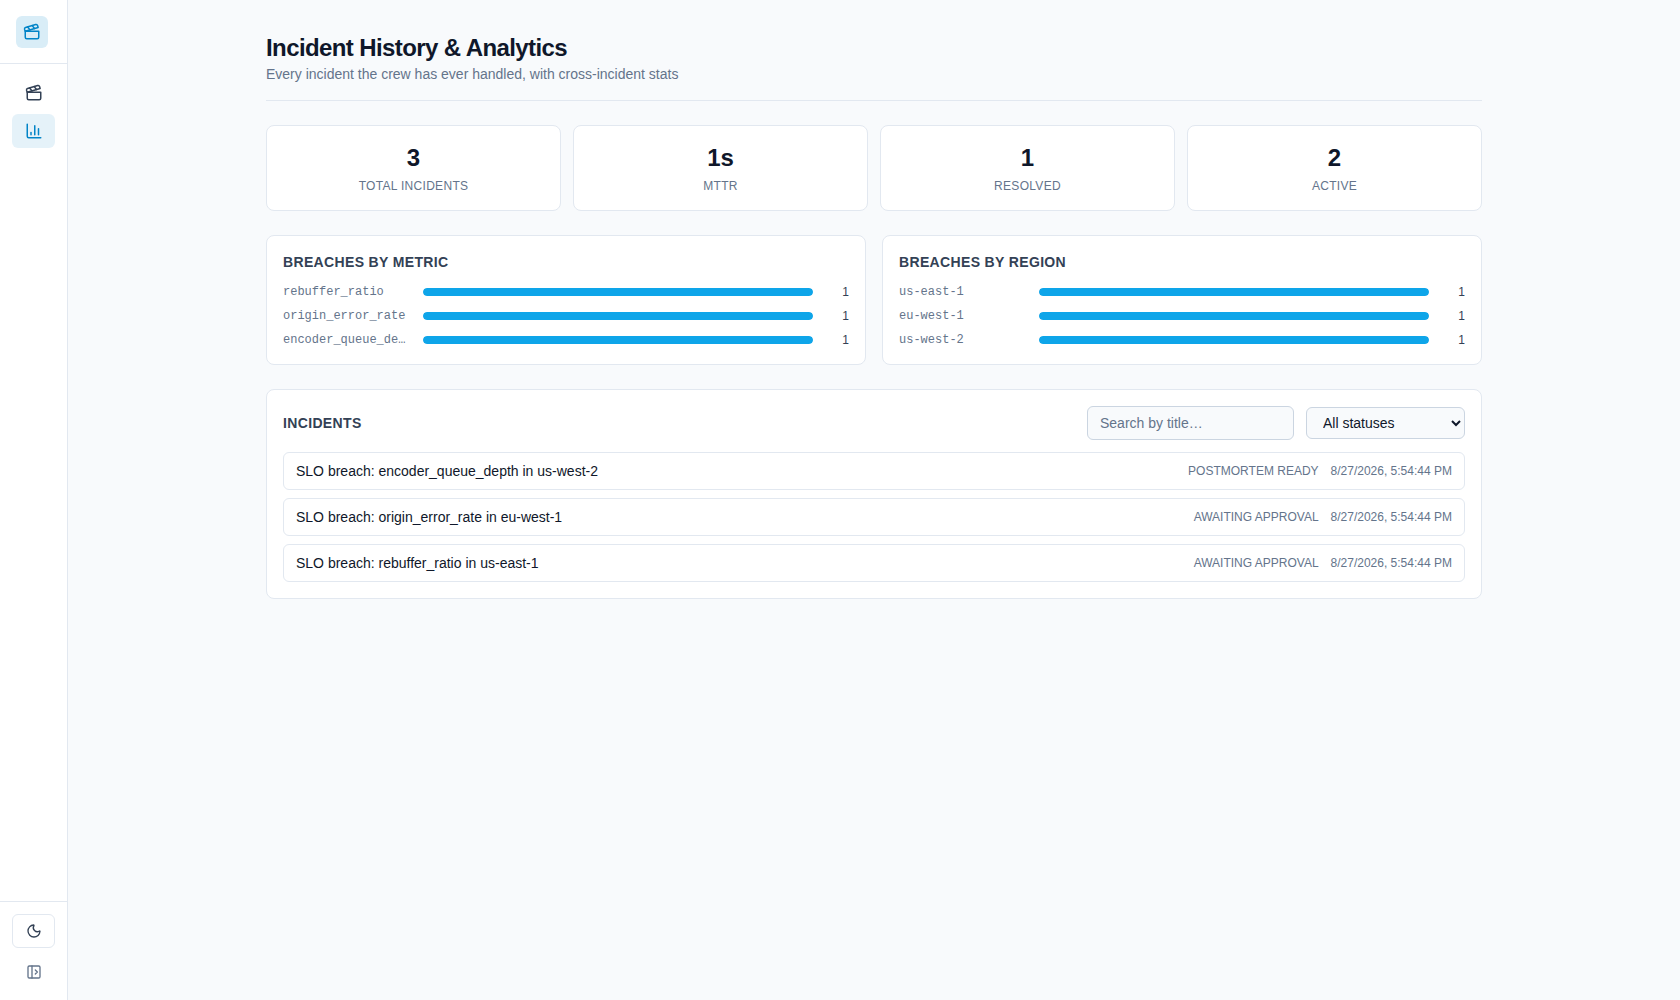
The History & Analytics page lists every incident the crew has ever handled, with cross-incident stats: total count, mean time to resolution, breach frequency by metric and by region, and — once the real Gemini crew has run — fleet-wide token usage and an estimated cost. Search and filter by status, and expand any incident to read (or download) its postmortem.
Audit Log
Every sensitive action — signing in, approving or rejecting a remediation, injecting an anomaly, user/workspace management — is recorded with the real actor's email, the action, and a timestamp. Visible to any signed-in operator or admin under Audit Log in the sidebar.
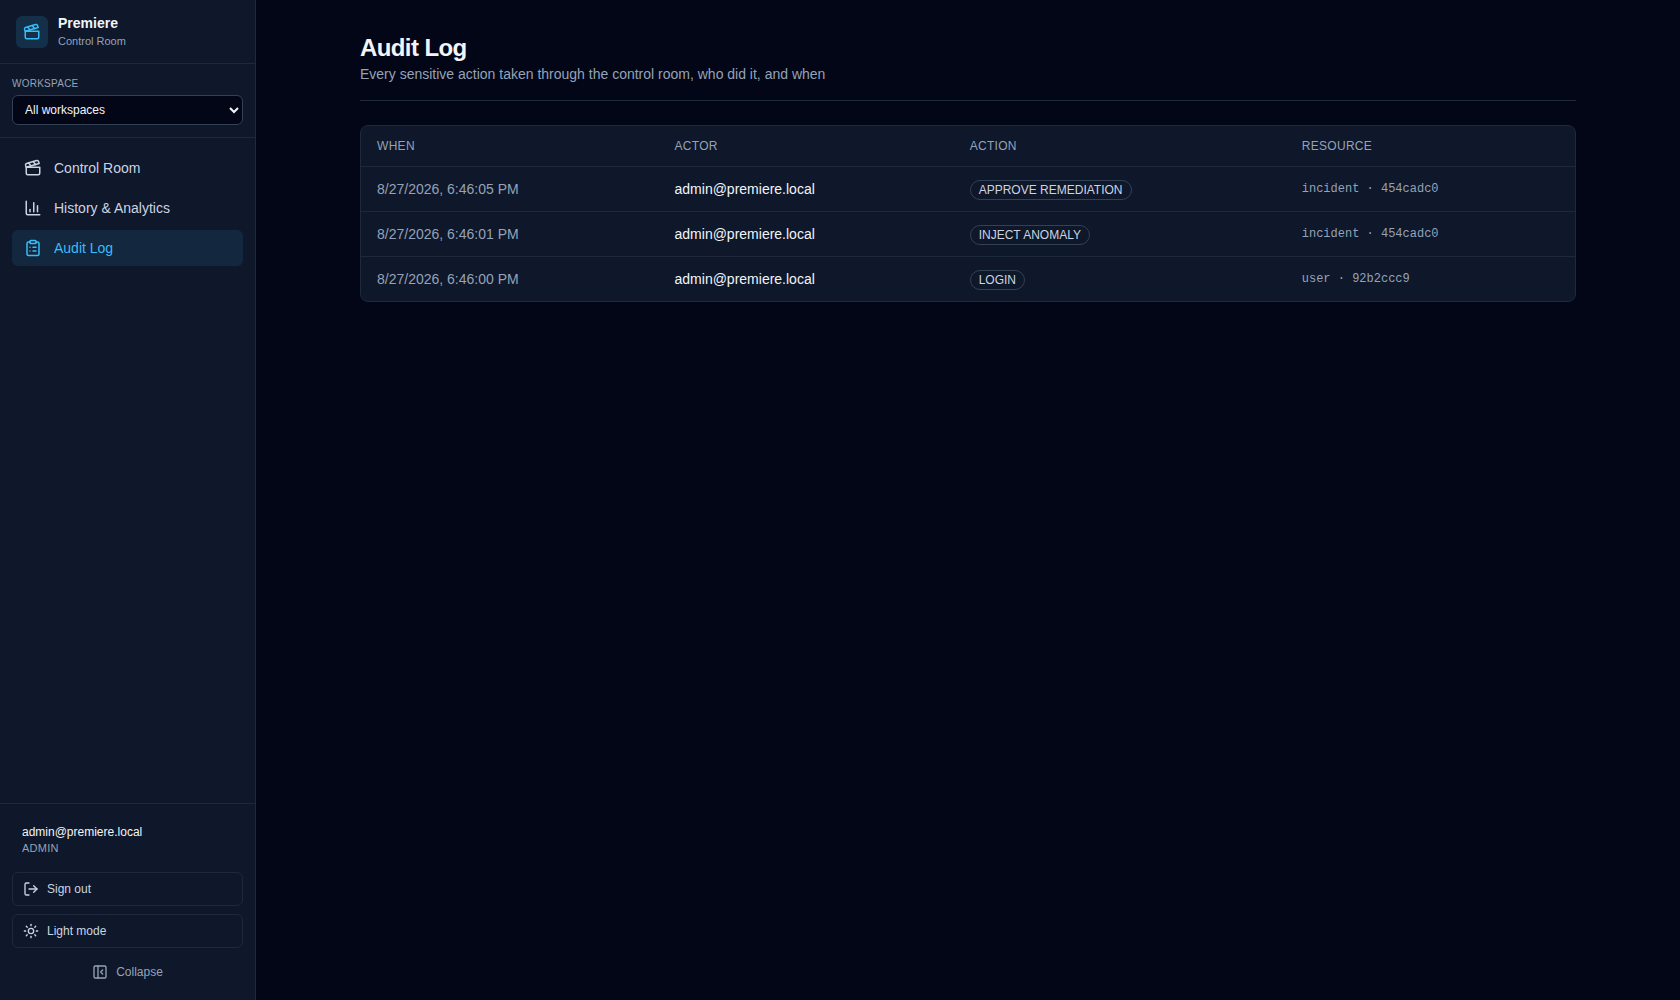
An approved remediation's recorded approver is always the person who actually clicked Approve — never something an LLM's own output happened to write for that field. See Security & Governance for the full reasoning.
Workspaces
If your deployment has more than one workspace (separate productions, events, or teams sharing one control room), a Workspace switcher appears at the top of the sidebar. Selecting one filters the control room and history views down to that workspace's incidents; "All workspaces" shows everything. Injecting a new anomaly always tags it with your own account's workspace — you can't inject into a workspace you don't belong to.
Appearance
The sidebar's theme toggle switches between light and dark mode (it remembers your choice, and otherwise follows your system setting). The Collapse button shrinks the sidebar to icons-only for more screen space — also remembered across visits.